What is it about?
Did you know that the average European produces 500 kg of household waste each year? And that only around half of the overall amount of municipal waste in the EU (more than 230 million tonnes) is recycled? This means that over 60% of household waste still ends up in a landfill in some EU countries. Out of that 500 kg produced by each European every year, 180 kg is packaging waste, of which only 64% is recycled. This is why the EU waste policy aims to further reduce waste and in particular packaging waste. By 2030, 70% of all packaging shall be recycled to support the EU’s transition to a circular economy.
Harmonised waste sorting labels in the EU can, on the one hand simplify consumers’ lives by making it easier to recycle and on the other, get us closer to achieving these ambitious goals!
Here, at the EU Policy Lab we set up a multidisciplinary team of behavioural and design experts from the Joint Research Centre (JRC) to help DG Environment in designing a harmonised labelling system for waste sorting that works for the European Union as a whole. This is part of the Proposal for a revision of EU legislation on Packaging and Packaging Waste published on 30 November 2022.
Waste journey (cycle) map
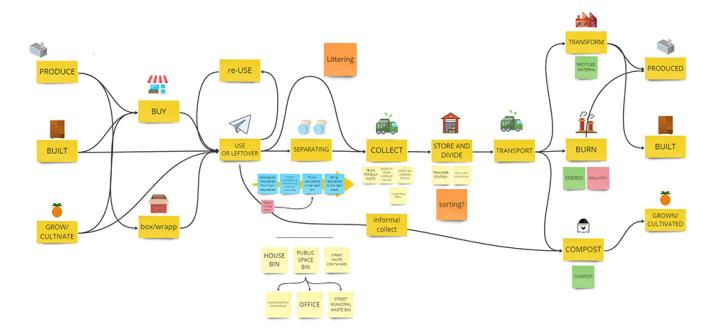
In a nutshell, our work is about designing and testing a labelling system for all sorts of packaging, bins, and garbage bags across the EU that make recycling easier and more appealing to Europeans. For this to become a reality, the packaging industry must be able to handle these labels, waste managers should apply them and citizens have to understand and act on them. More importantly, the new system and its labels should be designed to last and to evolve, while at the same time be adaptable to cultural differences and infrastructures across the continent. Overall, this system should facilitate and improve waste sorting behaviours in all EU countries no matter their starting point.
Are you an expert in the field of waste management?
How are we doing this?
To tackle this big challenge, we are building on a previous success story of the Nordic System.
- The first step is to test the Nordic system as a prototype (or hypothesis) and understand its potential and limitations as an EU-wide system. The final design will be a version of this system that has been adapted and redesigned through continuous and rapid prototyping and testing in several iterations.
- Since we want to open this process to as many relevant voices as possible, we are engaging both with expert stakeholders and citizens as much as possible (living in urban and rural areas, with ages ranging from young to senior).
- The design of the nomenclature and its labelling system go hand in hand and should be based on the behavioural evidence and design insights from all strands of work, which is why the work of the JRC will be conducted together with external experts.
- We will include surveys, online and in person co-design workshops, and online experiments to bring citizens’ ideas, opinions and behaviours into this endeavour.
What did the first survey show?
To kick off this work, we surveyed waste stakeholders to get a picture of what waste sorting and waste labelling look like in the EU. The survey primarily asked about the specifics of each country, region or even municipality. We focused in particular on:
- The organisation of waste management
- The type of waste disposal for different types of waste
- The colour coding for the different types of waste
- The separate or combined collection of different types of waste
- Labels and pictograms used on receptacles and/or packaging
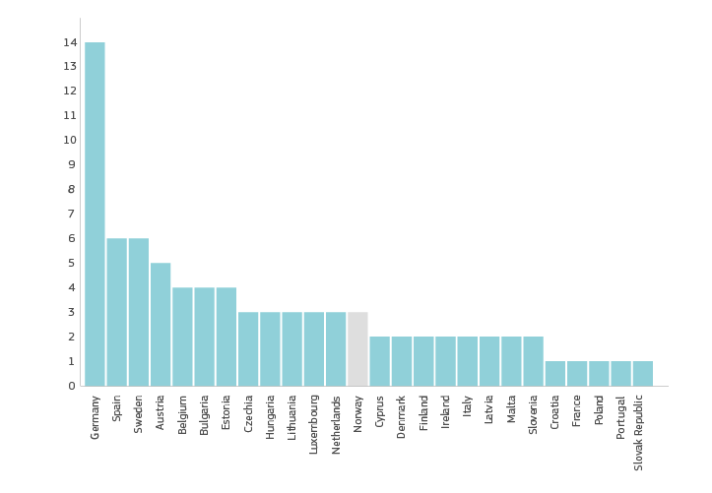
So far, 82 experts responded to the survey, most of them coming from Germany, followed by Spain, Sweden and Bulgaria as shown below. Greece, Croatia, and Romania have not participated yet, but the survey is still open and we welcome as many submission as possible!
So what are the three main insights gained through the survey?
1. How waste is collected in the EU
The first insight relates to the type of waste collection for each material as shown in the figure below. As you can tell, there is a lot of heterogeneity regarding how different waste materials are being collected in the different European Member States. For example, plastics are mostly collected in door-to-door / curbside pickups, but also disposed of in civic amenity sites or drop-off / collection points. Some deposit refund schemes, home composting, or other types of collection types for plastics also exist.
Type of waste collection by material
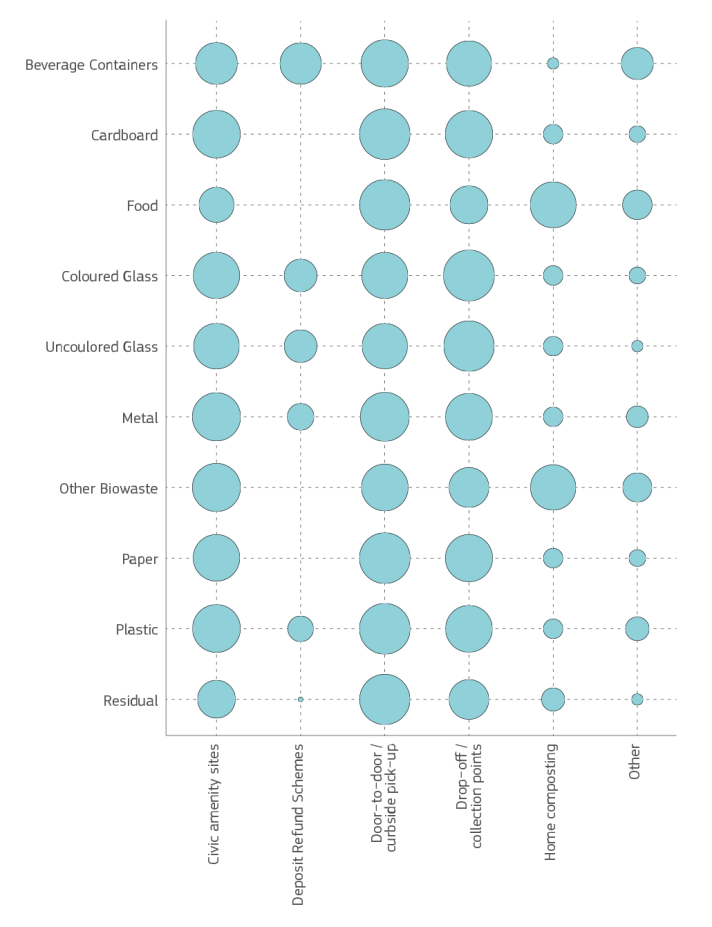
The figure shows how waste materials are typically collected across the European Union, with waste collection types displayed along the bottom and waste materials shown on the left. Each bubble represents a combination of a waste material and waste collection type. The size of the bubble indicates how frequently that particular waste collection type is used for the corresponding waste material. The bigger the bubble, the more often that waste collection type is used for that waste material. The size of the bubbles can only be interpreted relatively, not in absolute terms (which explains the absence of a legend).
2. Which colours are associated with which waste materials in the EU
The second insight relates to the colour of the bin (or label) that is mostly associated with each waste material. This is visualised in the figure below. Here as well, the heterogeneity within the EU Member States is remarkable. For example, cardboard is predominantly associated with the colour blue (as is paper, which makes sense because they are often collected together, see below) but also sometimes with yellow, red, and other colours. Some aspects of waste collection however are already homogeneous. Glass, for instance, is mainly associated with dark and light green, while brown is predominantly associated with food waste and other bio waste. While these insights are important for us to understand the current situation in the EU, it is important to note that there are currently no plans to harmonise colours with respect to waste in the EU.
Waste type by bin colour
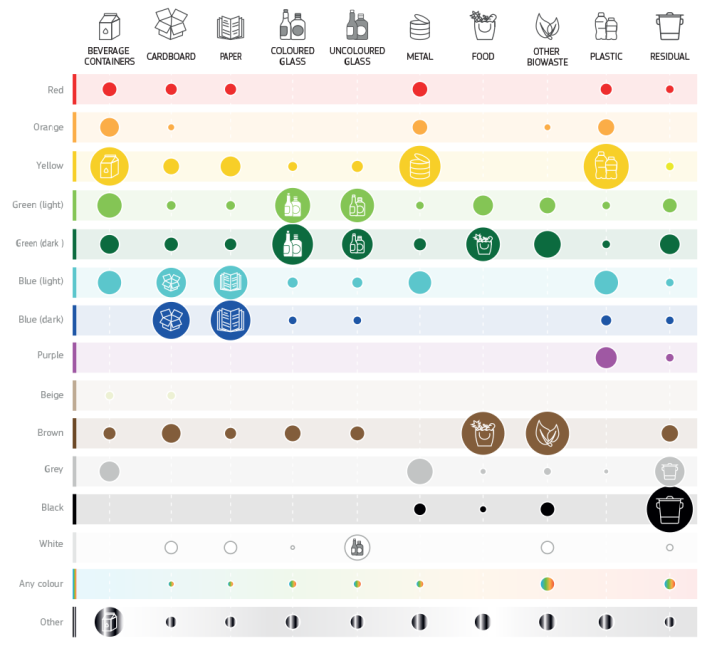
The figure illustrates how different types of waste materials (shown on the top) are typically disposed of in different coloured bins (shown on the left) across the European Union. Each bubble represents a combination of a waste material and bin colour. The bigger the bubble, the more frequent that bin colour is used for that waste material. The colours of the bubbles correspond to the colours of the bins. The size of the bubbles can only be interpreted relatively, not in absolute terms (which explains the absence of a legend).
3. Which waste materials are collected together in the EU
The third insight relates to the collection of different waste materials in the same bin (bag, or container, in short: receptacle). This is visualised in the last figure. For example, cardboard and paper are often collected together. The same applies to plastics and beverage containers, metal and plastics (and to some extent metal and beverage containers), and of course coloured and uncoloured glass. Residual waste is often collected separately from other waste materials.
Heat map: material most often combined in a single bin
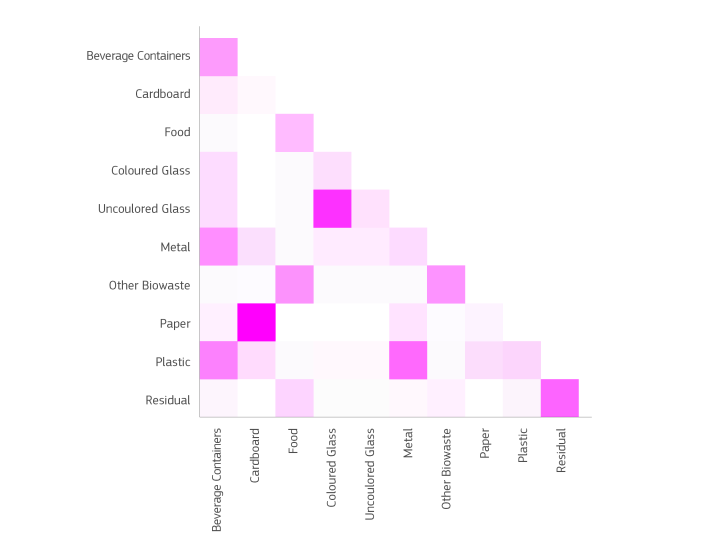
The figure shows the different waste materials and how often they are collected together in the same bin. Each coloured box represents a combination of two different waste materials. The darker the colour of the box, the more often those two materials are found together. To find the frequency of a specific combination, locate one waste material on the left side of the graph and find the corresponding waste material on the bottom of the graph. Then, look at the shading of the box where the two meet to see how often they are collected together. Note that the boxes on the diagonal show how often a waste material is found by itself in a bin. The darker the box, the more often that waste material is found alone in a bin.
Featured image by Karina Tess on Unsplash
Details
- Publication date
- 2 May 2023
- Author
- Joint Research Centre
- EU Policy Lab tags